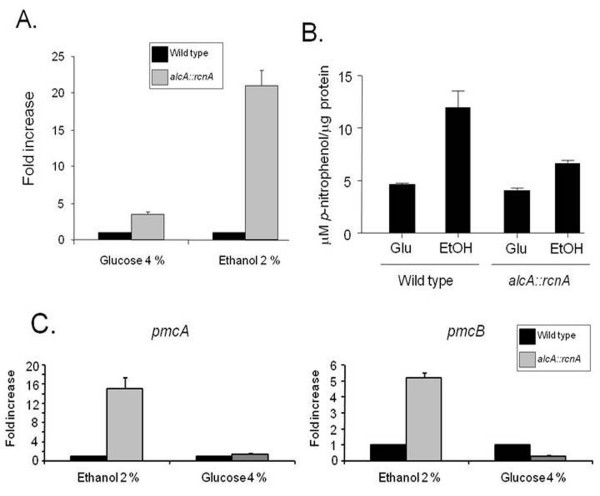
Figure 7.
Overexpression of the A. nidulans AnrcnA gene. (A) Fold increase in AnrcnA mRNA levels after the growth of the wild type and alcA::AnrcnA mutant strain in MM+4% glucose and MM+2% glycerol+100 mM ethanol for 6 hours at 37°C. (B) Wild type and mutant strains were grown in MM+2% glycerol for 18 hours at 37°C and then transferred to either MM+4% glucose or MM+2% glycerol+2% ethanol for additional 6 hours at the same temperature. Mycelial protein extracts were processed and calcineurin activity measured. (C) A similar experiment as described in (B) was performed and pmcA and pmcB mRNA accumulation was evaluated by real-time RT-PCR. For (A) the relative quantitation of all the genes and tubulin gene expression was determined by a standard curve (i.e., CT -values plotted against logarithm of the DNA copy number). The results are the means standard deviation of four sets of experiments. The values represent the number of times the genes are expressed compared to the corresponding wild type control strain (represented absolutely as 1.00).

