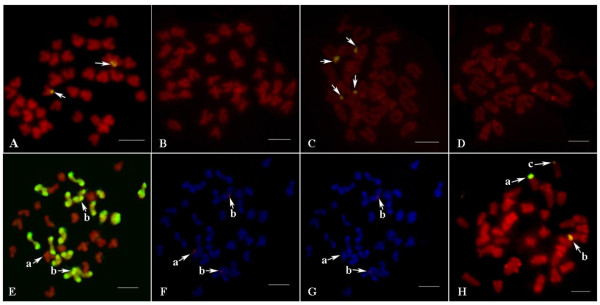
Figure 4.
Chromosomal locations of the parental ITSs in the hybrid. (A) FISH in C. farreri with probe from C. farreri (signals are shown by arrows); (B) FISH in C. farreri with probe from A. irradians (no signal is detected); (C) FISH in A. irradians with probe from A. irradians (signals are shown by arrows); (D) FISH in A. irradians with probe from C. farreri (no signal is detected); (E) GISH in the hybrid with genome probe from A. irradians (a shows the ITS-bearing chromosome of C. farreri; b show the ITS-bearing chromosomes of A. irradians; metaphases in E, F and G are same); (F) FISH in the hybrid with probe from C. farreri (signals are detected at a and b); (G) FISH in the hybrid with probe from A. irradians (no signal is detected at a but weak signals are detected at b); (H) FISH in the hybrid with probe from C. farreri (a shows the ITS-bearing chromosome of C. farreri; b, c show the ITS-bearing chromosomes of A. irradians; signal intensity at b is higher than that at c). Scale bar represents 5 μm.

