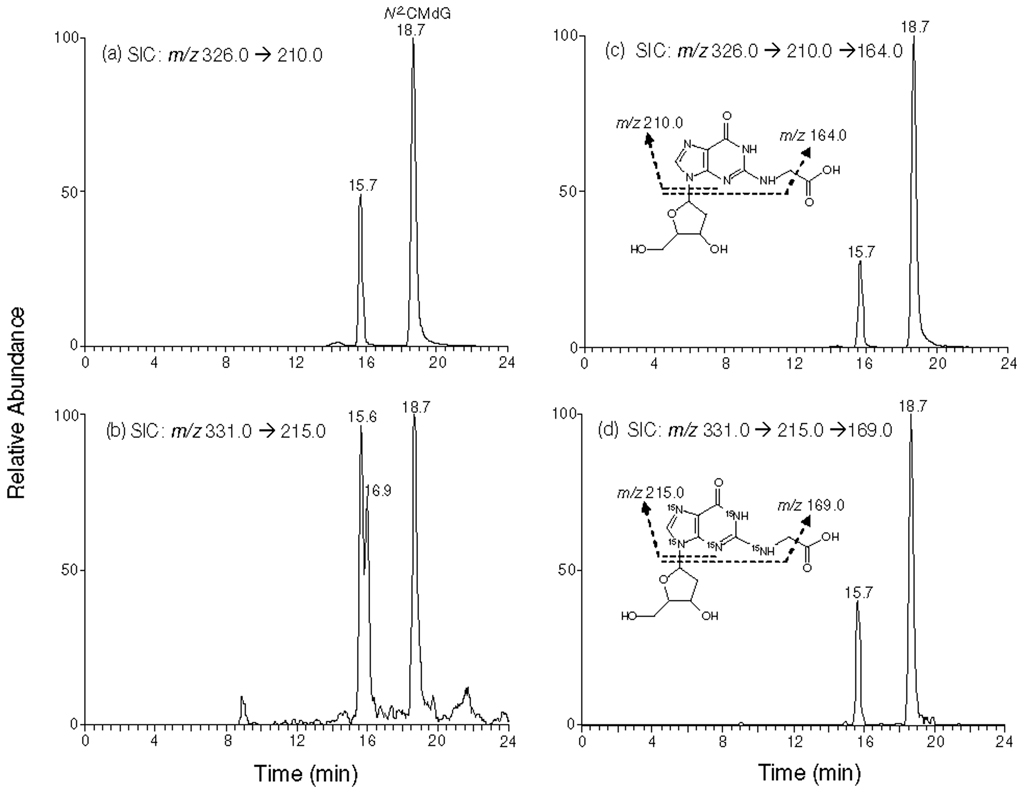
Figure 3.
Selected-ion chromatograms (SICs) for monitoring m/z 326➔210 (a) and m/z 326➔210➔ 164 (c) (for unlabeled N2-CMdG) as well as the m/z 331➔ 215 (b) and m/z 331➔ 215➔ 169 (d) (for [U-15N5]-N2-CMdG) transitions of the digestion mixtures of calf thymus DNA which was treated with 250 µM of glyoxal. The peak at 15.7 min in Figure 3b was identified as1,N2-glyoxal-dG based on its co-elution with the added [U-15N5]-1,N2-glyoxal-dG, and the one at 16.9 min in Figure 3b might be due to the presence of isobaric interferences, as evidenced by the absence of the corresponding peak in the SIC obtained from MS/MS/MS analysis (Figure 3d and discussion in text).

