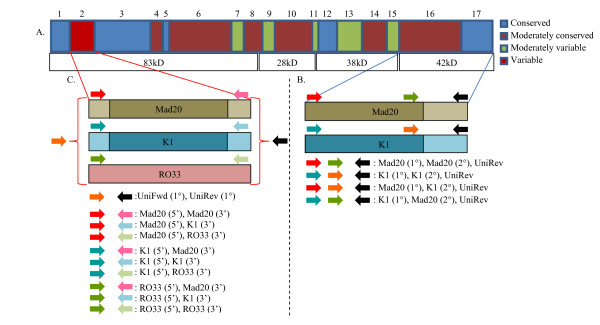
Figure 1.
A-C - Genotyping methods for Pfmsp1-42KD and Pfmsp1-B2. A) Schema of Pfmsp1, indicating contrasting regions of conservation and variability. B) Highlights the Pfmsp1-42KD region of Pfmsp1. The polymorphic nature of Pfmsp1-33KD is indicated by the darker shades at the C-terminal end of the Mad20 allele (tan) and K1 allele (blue), while the lighter shades are used to indicate increased conservation. Colored arrows, defined in the figure, are used to illustrate the position of the primers used in PCR amplification. The colored arrows, with the same definition as found in (A), are used to illustrate the combination of primers (Mad20 or K1) used when testing for permutations that may have been observed due to interfamily sexual recombination. C) Highlights the three allelic families detected as a result of using the Roberts et al [22] method. Stemming from the polymorphic Pfmsp1B2 region, illustrated as the red block, are those three allelic families: Mad20 (tan), K1 (blue), RO33 (pink). Darker shades at the center of Mad20 and K1 are used to indicate increased genetic variation due to it the presence of a variable repeat-length region. Colored arrows, defined in the figure, are used to illustrate the position of the primers used in PCR amplification. The colored arrows, with the same definition as found in (A), are used to illustrate the combination of primers (5' or 3') used when testing for permutations that may have been observed due to interfamily sexual recombination.

