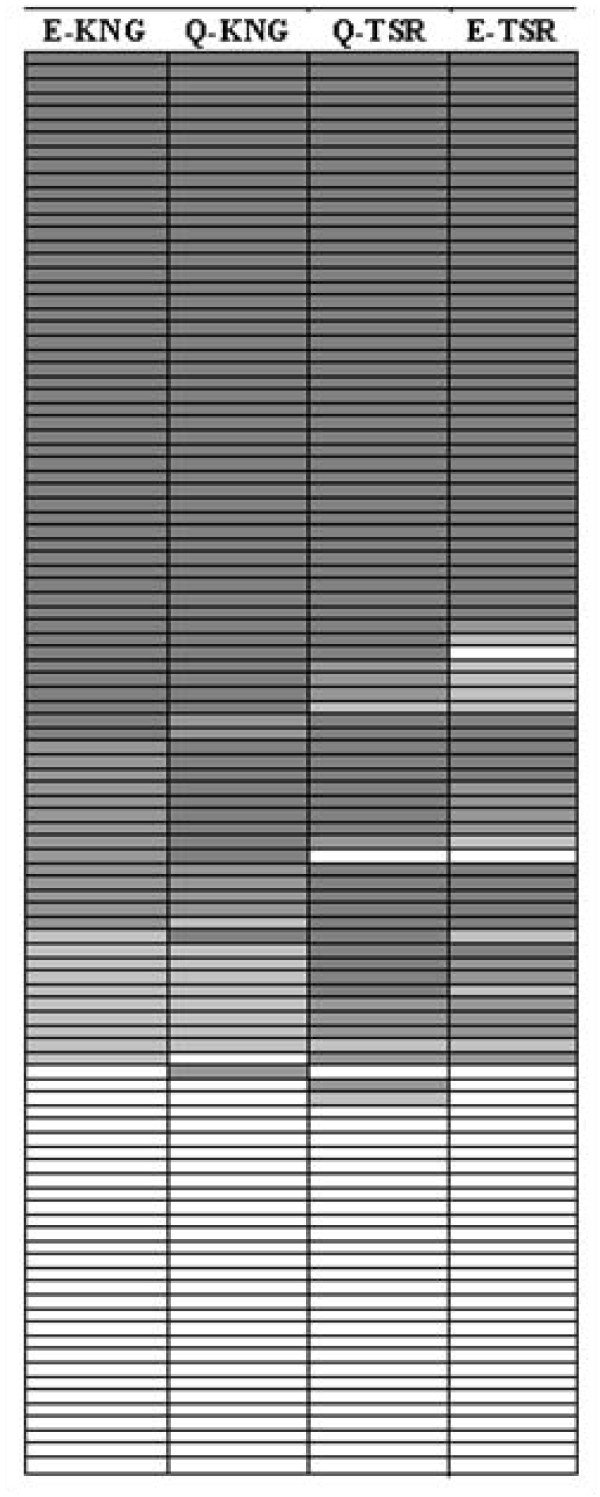
Figure 3.
Tabular comparison of concordance between the four Pf MSP1-19KD alleles. N = 105, dark grey = high positive antibody response (values greater than 2 * negative cut-off for each allele), medium grey = medium positive response (values between 1.5 * the negative cut-off and 2 * the negative cut-off), light grey = low positive response (values between the negative cut-off and 1.5 * negative cut-off), and white = negative antibody response (values less than the negative cut-off). Each row represents a different code/date.

