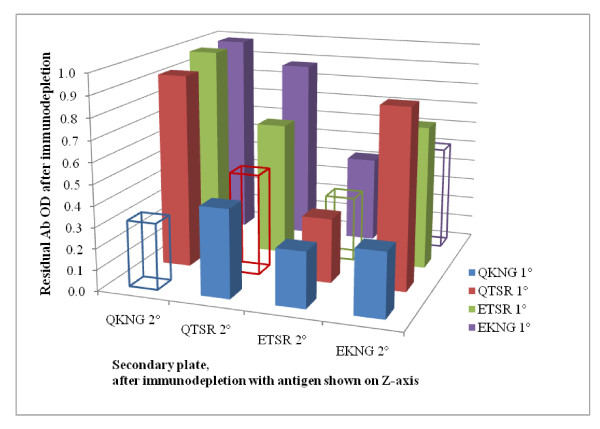
Figure 4.
Immunodepletion results. The mean residual antibody OD values are shown on the y-axis, antigens that underwent immunodepletion are shown on the z-axis, and secondary antibody responses are shown on the x-axis. The range for all samples was 0.019-0.142. The standard error of most comparisons was low (with a range of 0.00-0.05), and so not shown on this graphic.

