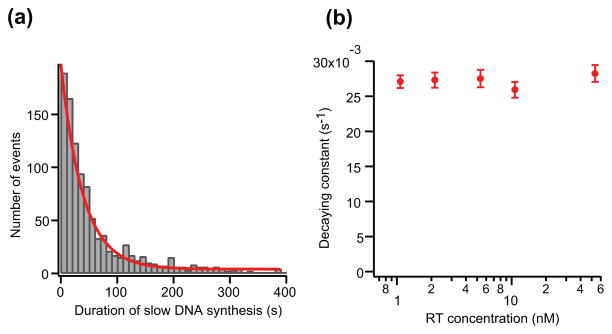
Figure 3. Enzyme concentration dependence of durations of slow DNA synthesis.
(a) histogram of durations of slow DNA synthesis regions observed during DNA polymerization of 11 nM HIV-1 RT. The histogram is well-fitted to a single exponential function with a decay constant 0.026 ± 0.001 s−1. (b) decay constants for the single exponential fit to histograms of slow synthesis durations measured at enzyme concentrations between 1–54 nM.

