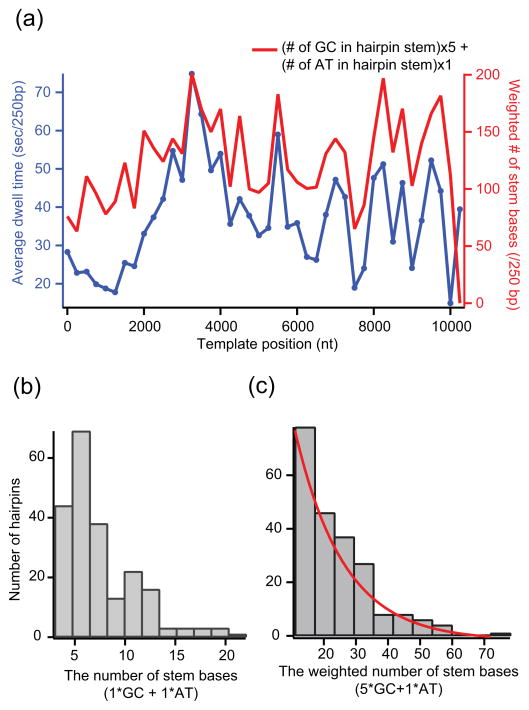
Figure 5. Relatively passive mechanism for strand displacement synthesis of HIV-1 RT.
(a) The average dwell time (blue, dot) is plotted with the weighted number of bases in hairpin stems in 250-base moving window (red, line). The number of hairpin stem bases is weighted according to the base content in order to account for different timescale for thermal opening in GC and AT base pairs. Correlation analysis between the two curves yields a Pearson coefficient of 0.87. (b) Histogram of the number of bases in hairpin stems found in λ DNA template. (c) Distribution of the weighted number of stem bases in the DNA template. This is a histogram version of the red curve in (a).

