
Fig. 6.
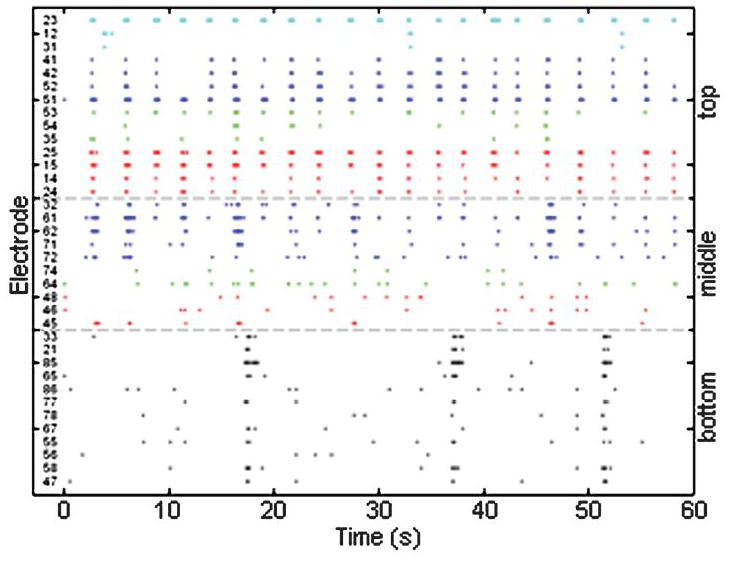
Spike raster plot for one device at 20 DIV. Each dot represents one action potential (spike) and each line depicts the activity from a single electrode. The plot shows widespread activity on all electrodes on all layers. Lines on a layer that are a similar color denote channels that have physical proximity within the device.