
Fig 8.
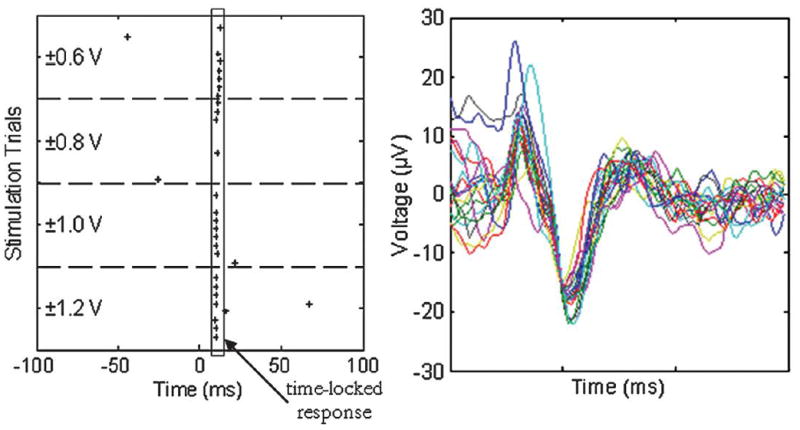
Raster plot from the stimulation trials and corresponding spike waveforms. The stimuli were delivered to Channel 23 (top layer) and the results shown are from Channel 71 (middle layer). Ten stimuli are delivered for each voltage level. The plot shows responses predominantly at 10 ms after the stimulus at t = 0.