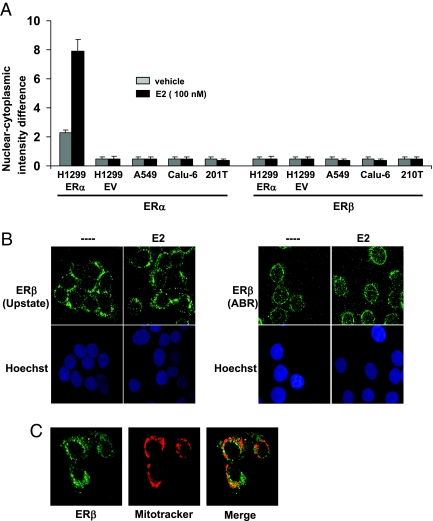
Figure 4.
ERβ translocation analysis. A, NSCLC cells grown in phenol red free media were treated with E2 for 1 h, and ER nuclear localization was measured by ArrayScan instrument as described in Materials and Methods. ERβ antibodies were from Upstate Biotechnology. Values are shown as means (±sd) from three identical wells. B, 201T cells grown in phenol red free media were treated with E2 for 1 h, and confocal microscopy studies were performed with ERβ antibodies from Upstate Biotechnology (left) and Affinity BioReagents (right). ERβ and nucleus staining are represented by green and blue, respectively. C, 201T cells were treated with Mitotracker Red, and ERβ was visualized as described above with antibodies from Upstate Biotechnology. Overlap is seen in yellow. ABR, Affinity BioReagents; EV, empty vector.

