
Fig. 3.
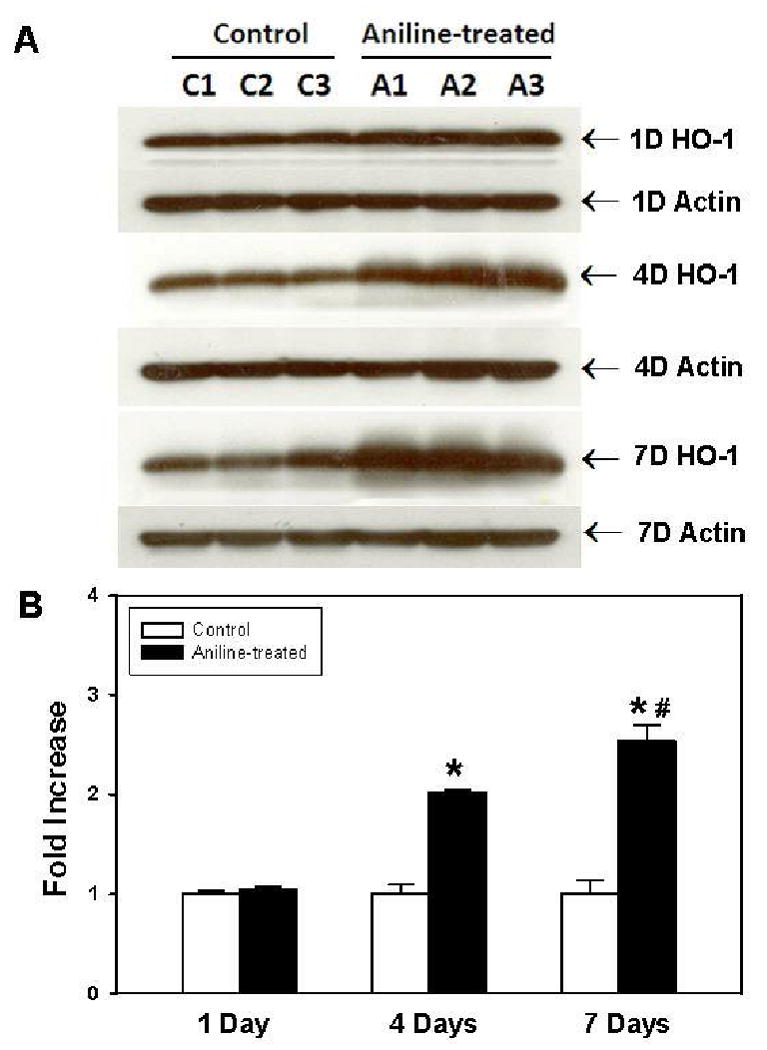
HO-1 protein expression in rat spleens following aniline exposure. (A) Western blot detection of HO-1 in the spleens of control and aniline-treated [1, 4 or 7 days (D)] rats. (B) Densitometric analysis of HO-1 bands. Values are means ± SD (n=3). *p < 0.05 vs. respective controls; # p < 0.05 vs. 4 days aniline group.