
Fig. 5.
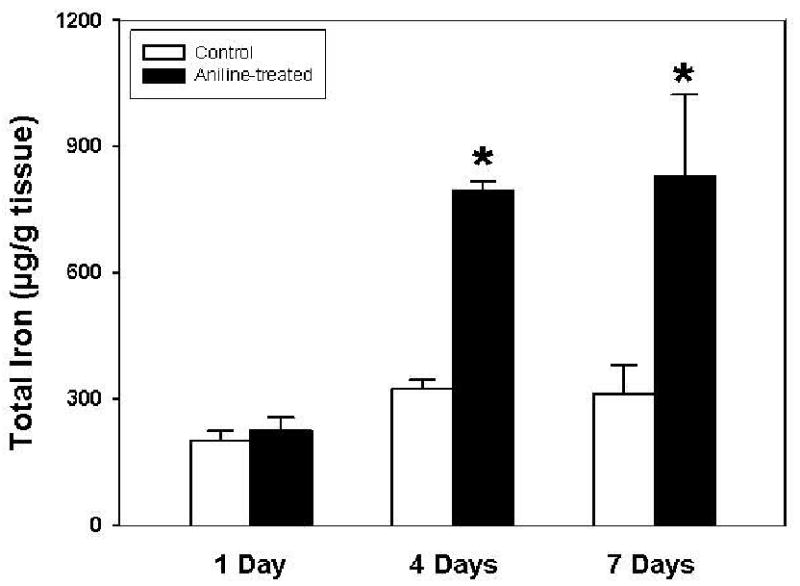
Splenic total iron content in the control and aniline-treated rats. Total iron was analyzed by atomic absorption spectrophotometry. Values are means ± SD (n=6). *p < 0.05 vs. respective controls.
Official websites use .gov
A
.gov website belongs to an official
government organization in the United States.
Secure .gov websites use HTTPS
A lock (
) or https:// means you've safely
connected to the .gov website. Share sensitive
information only on official, secure websites.
Splenic total iron content in the control and aniline-treated rats. Total iron was analyzed by atomic absorption spectrophotometry. Values are means ± SD (n=6). *p < 0.05 vs. respective controls.