
Figure 1.
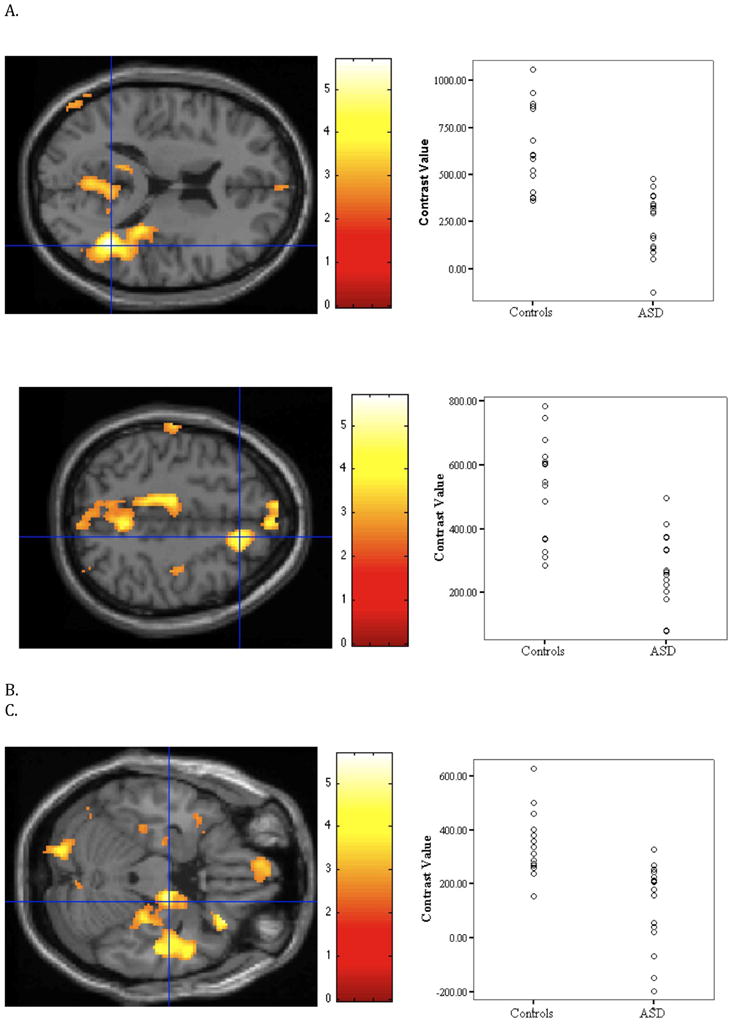
Relative to the ASD group, the control group showed stronger connectivity in nine of the eleven areas of the default network (small volume-corrected). The figure illustrates three of the areas where group differences were found. Images on the left side depict the area of activation and the scatterplots on the right side show the strength of connectivity of each individual in each group. (A) Right temporal lobe t(29) = 5.68, xyz = 42 −52 16. (B) Right superior frontal gyrus, t(29) = 4.77, xyz = 14 26 48. (C) Right parahippocampal gyrus, t(29) = 4.50, xyz = 18 −12 −22. For illustration purposes, the threshold was set at p < 0.01 with a cluster size of k > 10 voxels for all images. To depict activation for each subject, contrast values were extracted from a 4mm sphere around the peak.