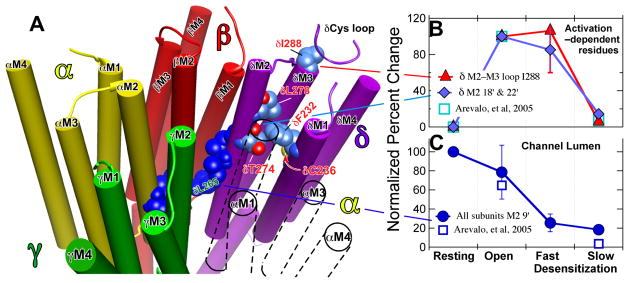
Figure 6. Location (Panel A) and contrasting state–dependence of the activation–dependent (Panel B) and the channel lumen (Panel C) groups of residues.
Panel A: A representation of the transmembrane region of the Torpedo nAChR based on the 2005 structure (2gb9.pdb: (5)). The receptor is viewed from the extracellular, N-terminal side and the structure is sliced to show the transmembrane domain (TMD) only. The subunits are color coded as follows (Alpha, yellow; Beta, red; Gamma, green; Delta, purple; the TMD of the second α–subunit that is situated between the γ– and δ–subunits is shown only in outline for clarity). The channel lumen residues are shown in dark blue; the M2–9′ residues are shown for each subunit and the M2–13′ & 16′ residues for the δ-subunit. The δM2–9′ Leu-265 is identified in green lettering. For the activation dependent–residues on the δ–subunit the carbon atoms are shown in corn blue, oxygen in red and nitrogen in mid blue; residues are identified in red lettering. In the top right near δIle-288 a portion of the δ–subunit’s Cys–loop from the LBD is shown in ribbon representation. Molecular graphics images were produced using the UCSF Chimera package from the Resource for Biocomputing, Visualization, and Informatics at the University of California, San Francisco (supported by NIH P41 RR-01081) (48). Panels B & C: The normalized efficiency of photoincorporation of [125I]TID as the nAChR passes sequentially from the resting through the open and fast desensitized states to the slow desensitized state. Panel B: The biphasic state dependence of photoincorporation into the activation–dependent residus in the δ–subunit; the residues are identified in the key. The percent change in each pair of experiments was calculated. The data for δM2–18′ & 22′ (Thr-274 and Leu-278) were grouped and averaged (2 replicates per point). For the δM2–M3 loop residue, Ile-288, there were two replicates for each state transition (Fig. 1 and Fig 2.). The data were then normalized with error propagation to the open state, which was set to 100. There was no photolabeling in the resting state, equal degrees of photoincorporation in the open and fast desensitized states and only modest photolabeling in the slow desensitized state. Panel C: The state dependence of the efficiency of photoincorporation into the channel lumen M2–9′ residues on the α–, β–& δ–subunits (αM2 Leu-251; βM2 Leu-257 & δM2 Leu-265). The data were analyzed as in Panel B. The percent change in each pair of experiments was calculated. We assumed 9′ leucine photoincorporation was equal in all subunits and averaged the data, which were then normalized with error propagation to the resting state, which was set to 100. For comparison the squares show data from our previous study (28) for the mean of δM2–18 & 22′ normalized to the open state (B) and for δM2 Leu-265 normalized to the resting state (C).

