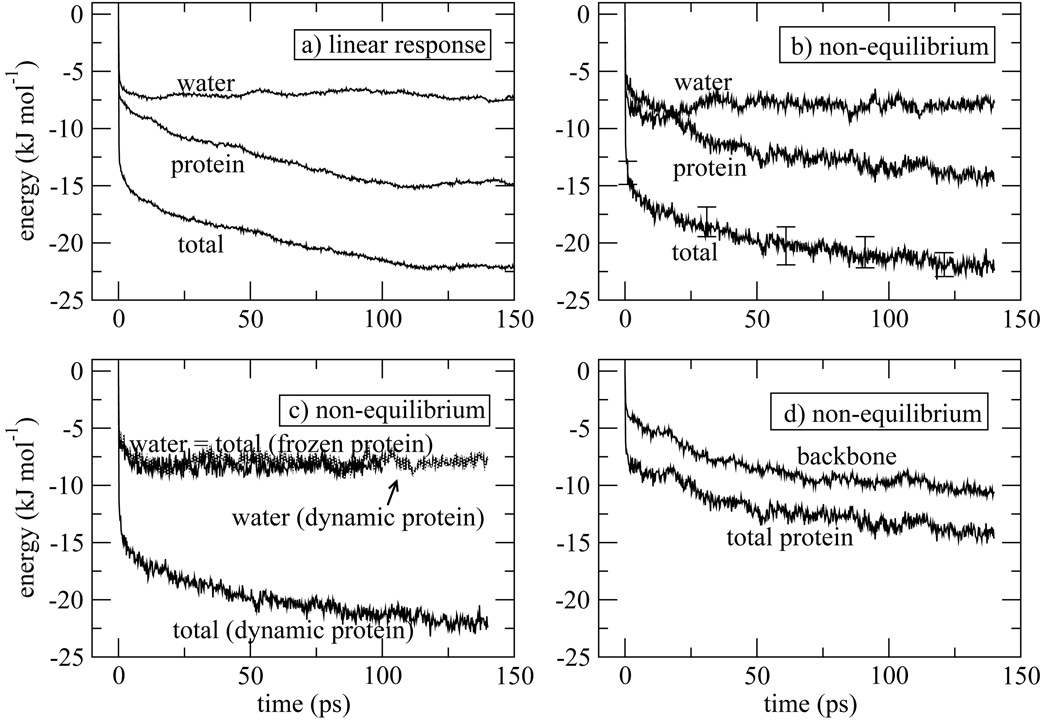
Figure 5.
Same as Fig. 4 but for isomer 2. The time interval used to calculate the the linear response correlation functions for isomer 2 and sampled for initial conditions of the non-equilibrium trajectories is indicated in Fig. 2a. 100 trajectories were used to calculate non-equilibrium response with full protein dynamics, and 200 trajectories with the protein frozen. In panel (d), the protein backbone response is compared with the total protein response, indicating that backbone dynamics dominates the protein response.

