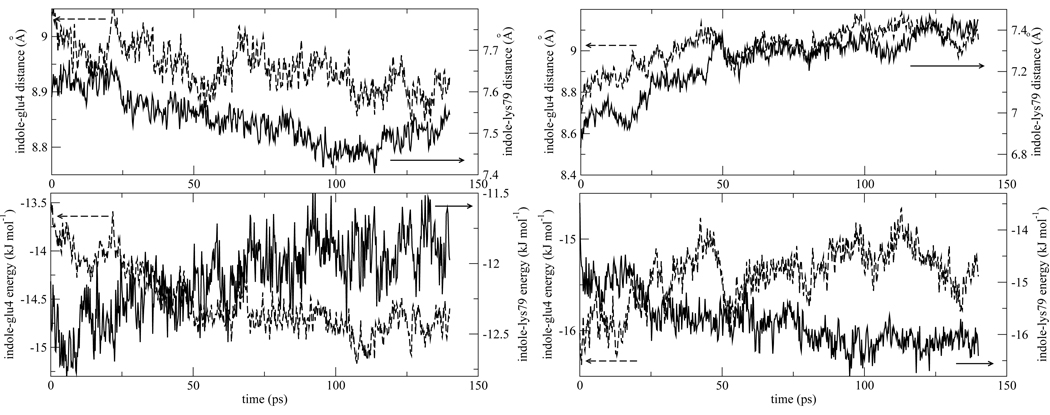
Figure 7.
Top panels: Time evolution of the distance of two nearby charged residues, Lys79 and Glu4, the indole chromophore in isomer 1 (left) and isomer 2 (right) following photo-excitation. Distances are measured from the center of mass of the indole chromophore to the center of masses of the side chain amino and carboxylic acid groups of the lysine and glutamic acid, respectively. In isomer 1 the distance both become smaller, while in isomer 2 they become larger. Bottom panels: The energetic response of the positively and negatively charged residues shows opposite trends for both isomer 1 and 2, and they roughly cancel. For comparison with data in Fig. 4 and Fig.5 the interaction energy difference between La and S0 states are plotted in the bottom panels.

