
Figure 1. Experiment One: Very high prevalence elevates false alarms and target absent RTs.
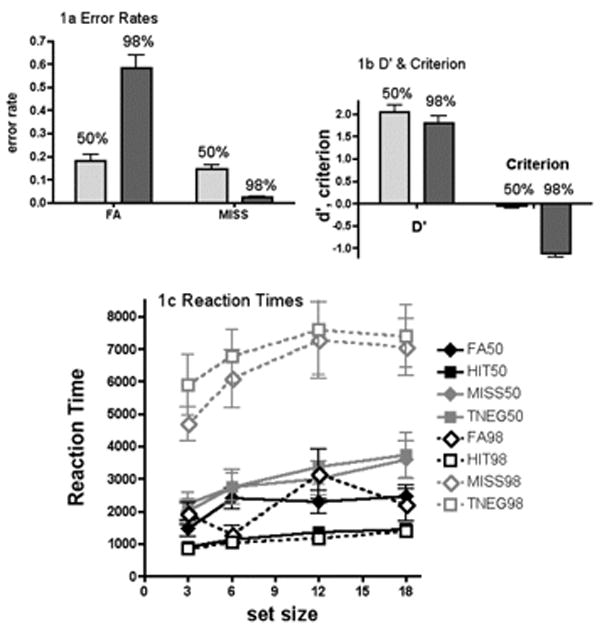
Fig 1a: False alarm and miss error rates as a function of target prevalence (50% and 98%), Fig. 1b: Signal detection measures: Average sensitivity (d′) and criterion (c ) values. Fig 1c: Average reaction time (RT) for correct target present (hit) and absent