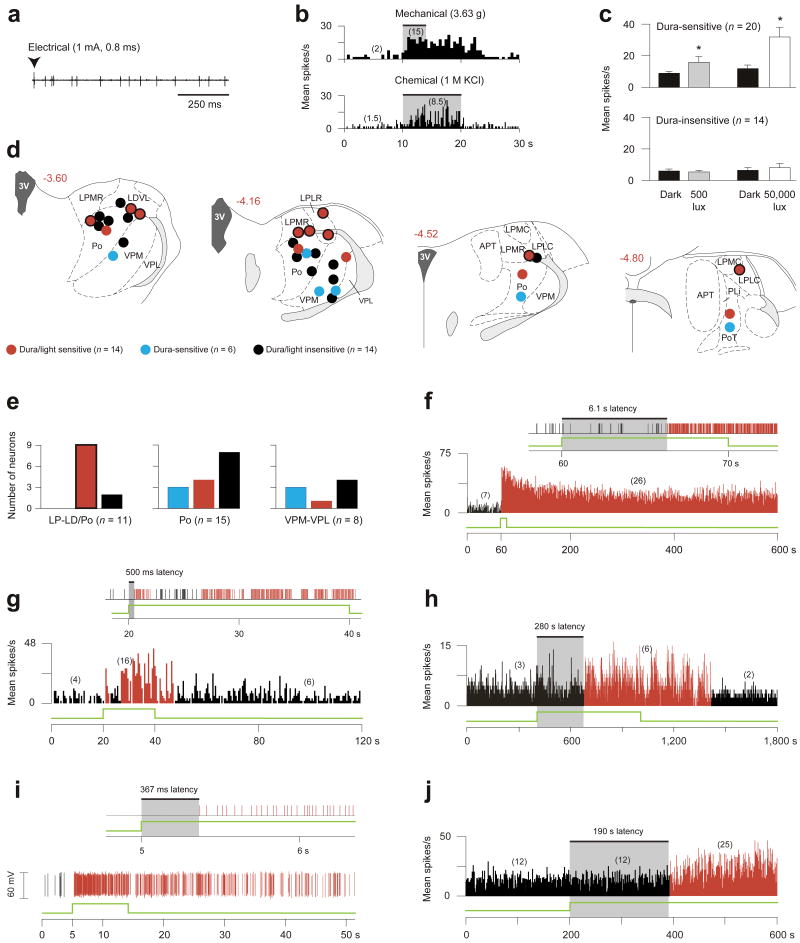
Figure 2.
Photosensitivity of dura-sensitive thalamic neurons. (a,b) Identifying neuronal responses to electrical (a), mechanical and chemical (b) stimulation of the dura. (c) Effects of ambient light (500 lux) and bright light (50,000 lux) on firing rate (mean ± s.e.m.) of dura-sensitive vs. dura-insensitive thalamic neurons (*P < 0.05; Wilcoxon matched-pairs signed-ranks test). (d) Histological localization of the recorded neurons. Drawings and numbers indicating distance from Bregma (mm) are based on Paxinos and Watson46. For abbreviations see text. (e) Graphic representation of the dorso-ventral localization of the neurons shown in d. Color coding same as in d; bordered red bar in left panel corresponds to bordered red circles in d. (f–j) Examples of delayed and immediate photoactivation of individual dura-sensitive thalamic neurons by 50,000 (f,g), 3,000 (h,i) and 500 lux (j) of white light (green line). Panels f, g consist of window discriminator spike output (top) and mean activity histogram (bottom). Panels h, j show mean activity histogram. Panel i consists of window discriminator output (top) and oscillographic tracing (bottom). Each of the light intensities induced delayed activation in some neurons (f,h,j) and immediate activation in others (g,i). Each of the light intensities induced prolonged activation that outlasted the stimulus by several minutes. Numbers in parentheses indicate mean spikes/s for the corresponding interval. Black and red bars indicate, respectively, baseline and enhanced periods of activity in response to light. Bin width are 0.5 (f,g,j) and 1 s (h).

