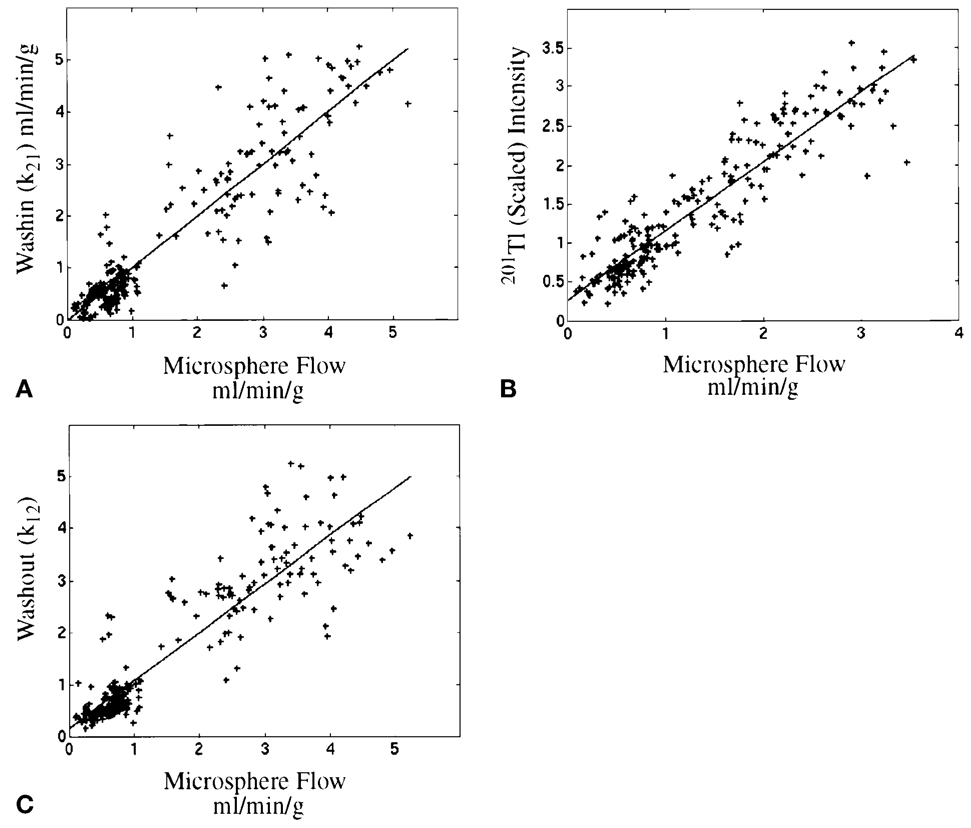
Figure 2.
Regression lines for data from 220 regions from 11 studies in nine dogs. (A) Microsphere flows vs. washin: r = 0.91 (y = 0.99x + 0.01). (B) Microsphere flows vs. 201Tl: r = 0.92 (y = 0.88x + 0.28). (C) Microsphere flows vs. washout: r = 0.91 (y = 0.89x + 0.26). In all cases shown here, the kinetic parameters and 201Tl uptakes were each scaled to match the average of microsphere-derived flows in each study.

