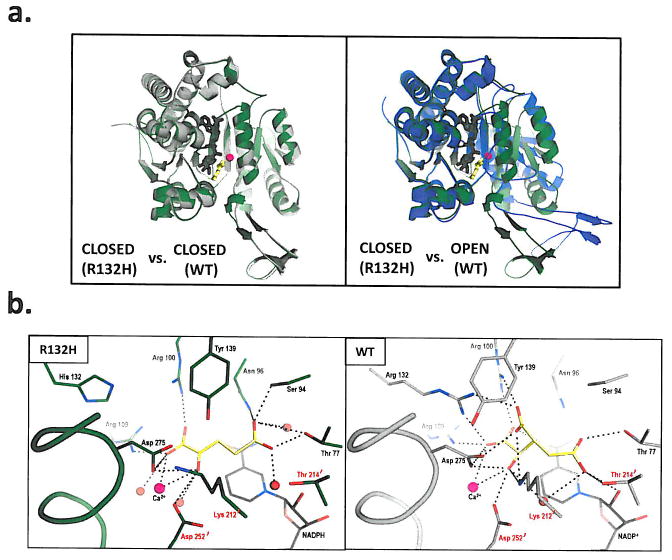
Figure 4. Structural analysis of R132H mutant IDH1.
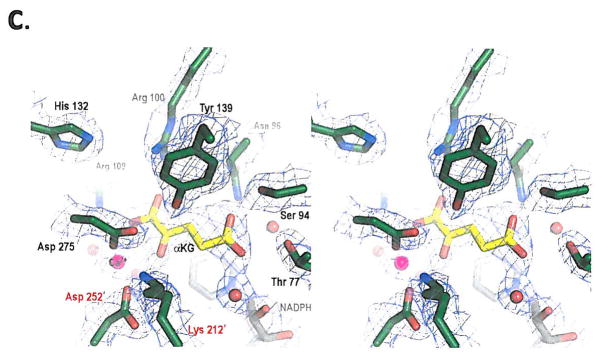
(a) On the left is shown an overlay of R132H mutant IDH1 (green) and WT IDH1 (gray) structures in the ‘closed’ conformation. On the right is shown an overlay of WT IDH1 (blue) structure in the ‘open’ conformation with mutant IDH1 (green) for comparison, (b) Close-up comparison of the R132H IDH1 active site (left) with αKG (yellow) and NADPH (gray) and the WT IDH active-site (right) with isocitrate (yellow) and NADP (gray). Residues coming from the other monomer are denoted with a prime (‘) symbol. In addition to the mutation at residue 132, the major changes are the positions of the catalytic residues Tyr 139 and Lys 212′. (c) Walleyed stereo image showing the composite omit map for αKG, NADPH, calcium ion, His 132 and other key catalytic residues in the R132H mutant active site contoured at 1σ level.


