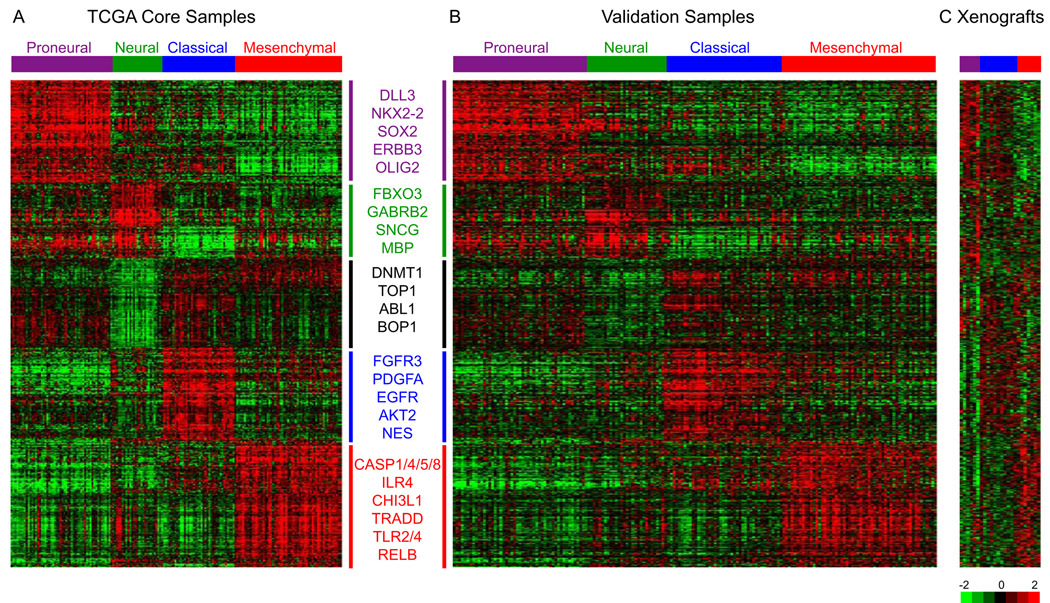
Figure 2.
Gene expression data identify four gene expression subtypes. (A) Using the predictive 840 gene list, samples were ordered based on subtype predictions and genes were clustered using the core set of 173 TCGA GBM samples. (B) Gene order from the TCGA samples was maintained in the validation dataset (n=260), which is comprised of GBMs from four previously published datasets. (C) Ordered gene expression for 24 xenograft samples. Samples are ordered based on their predicted identity using the 840 gene list. Selected genes are displayed for each gene expression subtype. Also see FigureS3 and TableS3.

