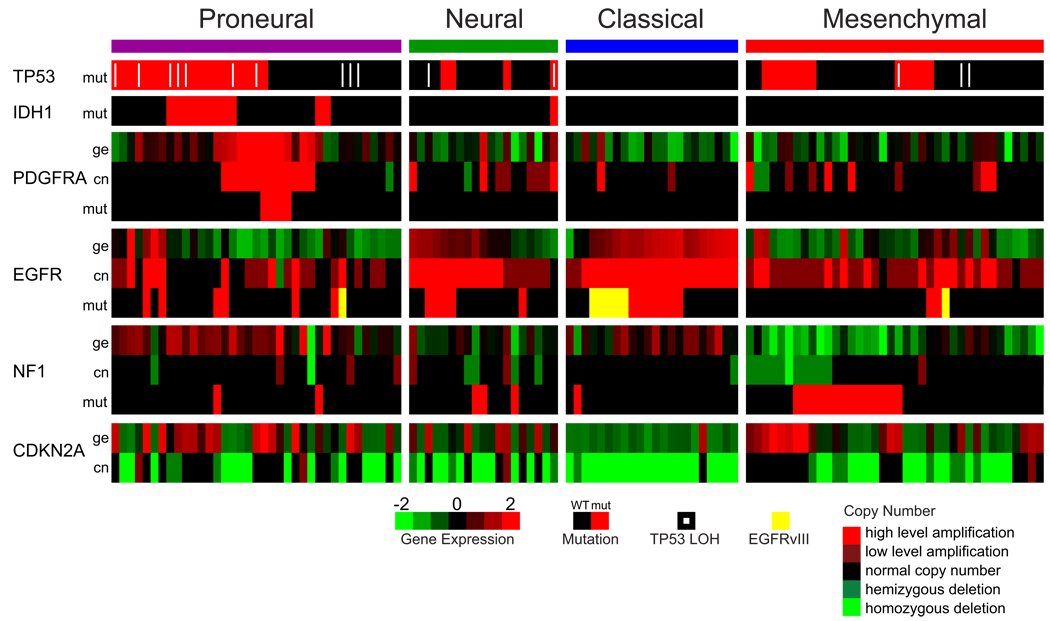
Figure 3.
Integrated view of gene expression and genomic alterations across glioblastoma subtypes. Gene expression data (ge) was standardized (mean equal to zero, standard deviation equal to 1) across the 202 dataset, data are shown for the 116 samples with both mutation and copy number data. Mutations (mut) are indicated by a red cell, a white pipe indicates loss of heterozygosity, and a yellow cell indicates the presence of an EGFRvIII mutation. Copy number events (cn) are illustrated by bright green for homozygous deletions, green for hemizygous deletions, black for copy number neutral, red for low level amplification, and bright red for high level amplifications. A black cell indicates no detected alteration.

