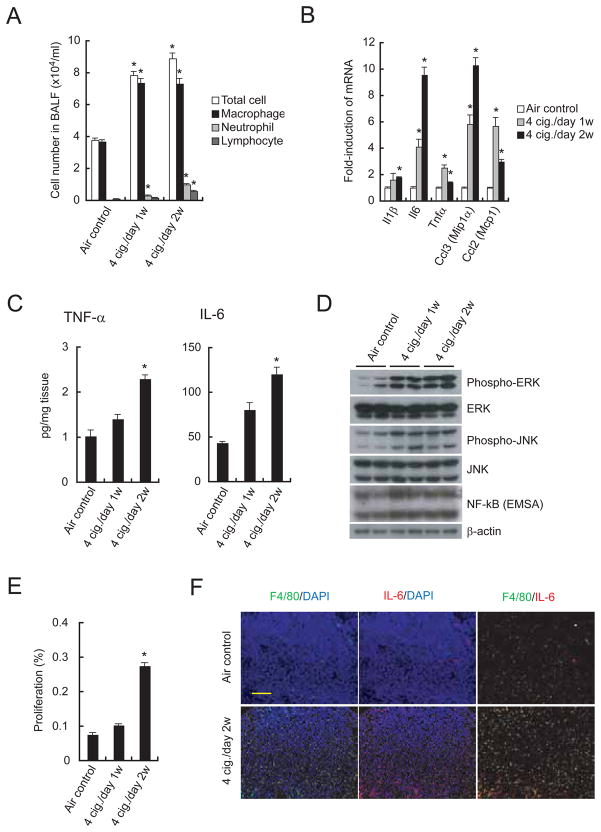
Figure 3. Tobacco smoke induces pulmonary inflammation and cell proliferation.
(A) Total cell number and leukocyte populations in BALF collected from C57BL6 males 24 hrs after last MTS or air exposure. Cellular composition was analyzed using cytospin preparations. Results are means ± S.E. (n = 8 for each group). Significant difference, *P < 0.02 vs. air control.
(B) Induction of inflammatory cytokine and chemokine mRNAs in lungs of MTS-exposed C57BL6 males. Lung RNA was isolated 24 hrs after last MTS exposure and analyzed by real-time PCR. Results are means ± S.E. (n = 5 for each group). Significant difference, *P < 0.03 vs. air control.
(C) Elevated cytokine secretion by lungs of MTS-exposed male mice. Fresh lungs were cut into small pieces and incubated in medium at 37°C for 48 hrs. Cytokines in culture supernatants were measured by ELISA. Results are means ± S.E. (air control: n = 7; 4 cig./day 1w: n = 9; 4 cig./day 2w: n = 9). Significant difference, *P < 0.02 vs. air control.
(D) ERK and JNK activation and NF-κB DNA binding activity in lungs of MTS-exposed mice. Lung lysates and nuclear extracts prepared 4 hrs after last MTS exposure were analyzed by immunoblotting and EMSA. Nuclear protein content was determined by immunoblotting with β-actin antibody. Shown are results from 2 representative mice per group.
(E) Cell proliferation in lungs of air- or MTS-exposed mice was determined by BrdU labeling. Results are means ± S.E. (air control: n = 7; 4 cig./day 1w: n = 5; 4 cig./day 2w: n = 8). Significant difference, *P < 4.0 × 10⁻⁵ vs. air control.
(F) Infiltration of IL-6 positive macrophages into K-rasLA2 lung tumors 2 weeks after initiation of MTS exposure. Lung sections prepared 24 hrs after last MTS exposure were analyzed by immunostaining for F4/80 (green) and IL-6 (red). Nuclei were counterstained by DAPI (blue). Scale bar = 100 μm. Results shown are for one representative mouse. For quantitation of the entire experiment see Figure S3F. See also Figure S3.

