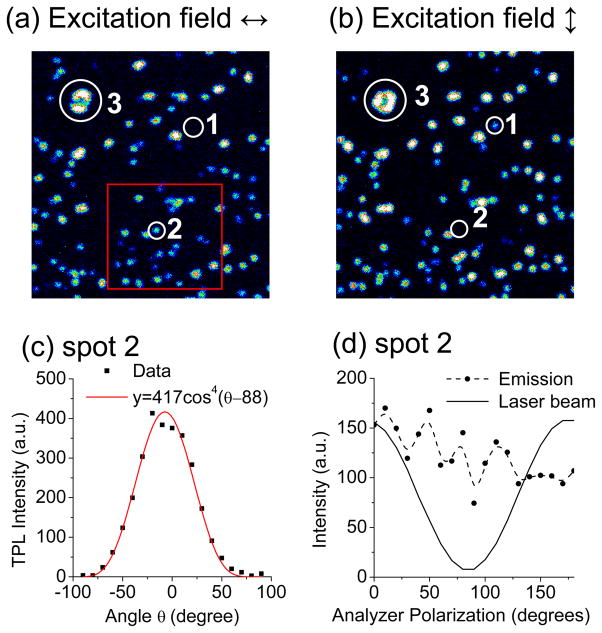
Figure 5. Polarization-dependent TPL intensities of gold NRs.
(18). (a,b) Pseudocolor images with horizontal (θ=0°) and vertical (θ=90°) excitation polarizations, respectively. Single NRs could be identified by their similar range of intensities (e.g. spots 1, 2); brighter spots were considered to be clusters of NRs (e.g. spot 3). (b) Polarization dependence of the TPL intensity (solid dots) for a single NR (spot 2). The excitation polarization was rotated clockwise from −90° to +90° in 10° increments. The TPL signal fits a cos4 function, offset by 6.8° (red curve). (d) The TPL emission (solid dots) from the same NR (spot 2) measured by rotating a polarizer before the detector. The reflected excitation beam was linearly polarized at the detector site (solid curve), but the TPL emission was essentially depolarized.

