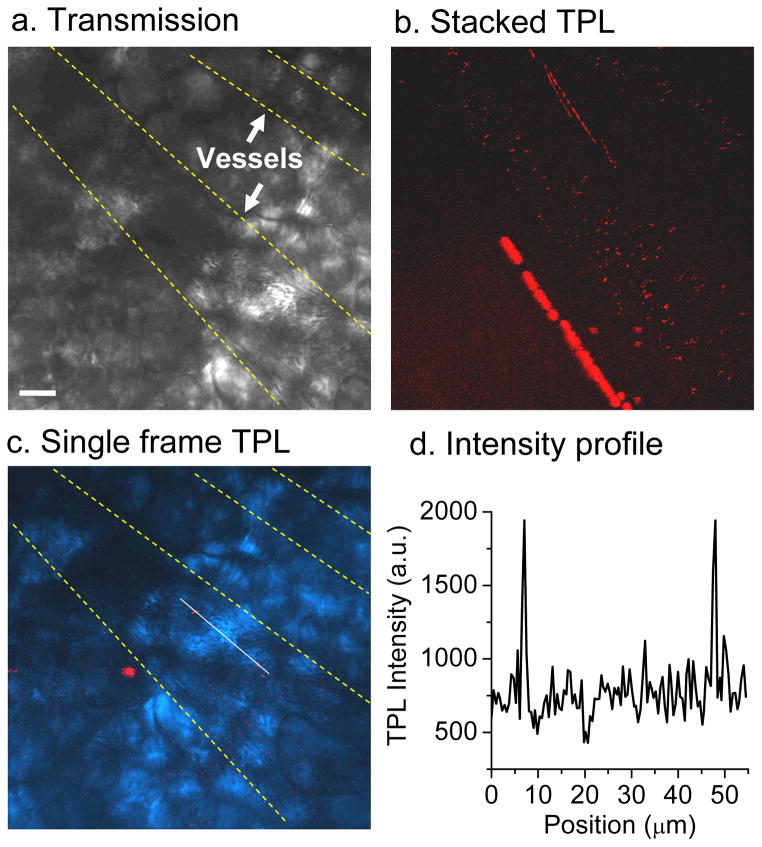
Figure 7. In vivo TPL imaging of NRs in blood vessels.
(18). (a) Transmission image with two blood vessels indicated. (b) TPL image of CTAB-NRs (red dots) flowing through blood vessels. The image was compiled by stacking 300 frames collected continuously at a rate of 1.12 s per frame. (c) Overlay of transmission image (blue) and a single-frame TPL image. Two NRs (red) are superimposed by a linescan. (d) TPL intensity profile from the linescan in (c). Bar = 20 μm.

