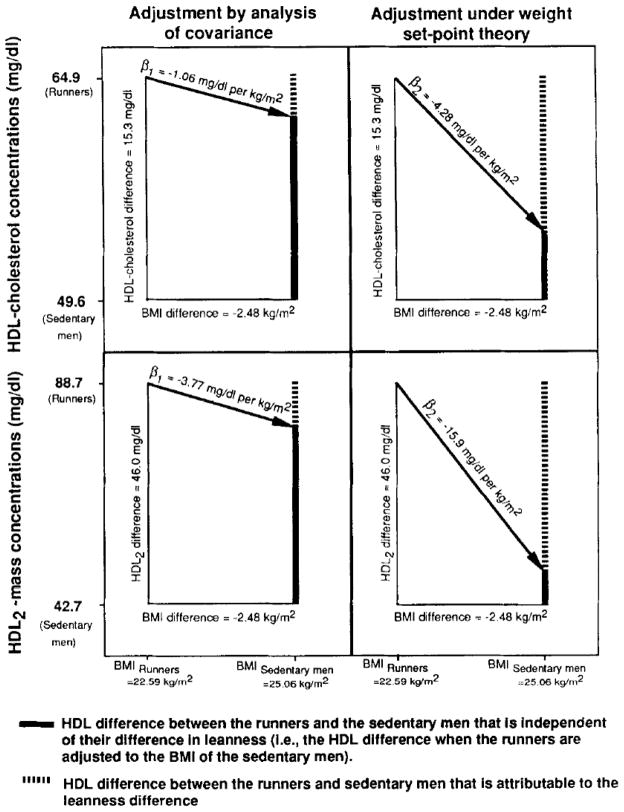
Fig 2.
Statistical adjustment of the mean difference in HDL-cholesterol and HDL2 concentrations between 12 long-distance runners and 64 sedentary [10] men under the ANCOVA and weight set-point models. The drop in the regression line that occurs between the runners’ and sedentary men’s mean BMI designates the portion of the HDL2 difference that is attributable to leanness. The weight set-point model replaces the cross-sectional regression slope used in the ANCOVA calculation with the regression slope for change in HDL versus change in BMI. Note that a substantially greater proportion of the HDL difference is attributed the runner’s leanness under the weight set-point model.

