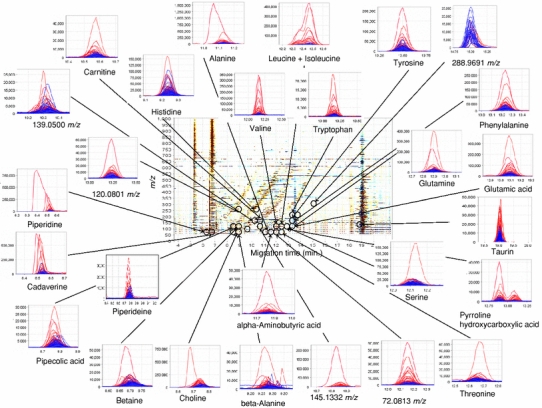
Fig. 1.

A summary of the different metabolome profiles of cations obtained from CE-TOF-MS analyses of salivary metabolites from control (n = 87) and oral cancer samples (n = 69). The X and Y axes represent the migration time and the m/z value, respectively. The color density reflects the difference in intensity between the averaged control and oral cancer samples. Black circles indicate peaks that are significantly different between healthy control and oral cancer samples (P < 0.05; Steel–Dwass test). The small linked figures include overlaid electropherograms of control (blue) and oral cancer samples (red)
