
Fig. 3.
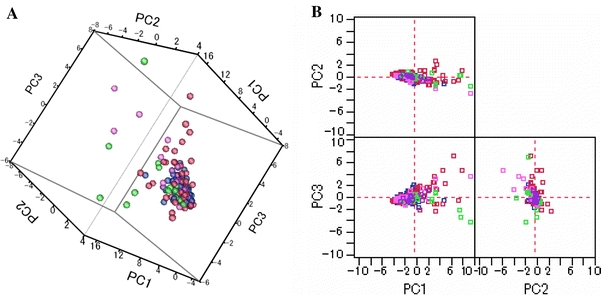
Score plots of principal components (PC) analyses. The subjects in all groups are shown in 3-dimensional (a) and 2-dimensional (b) plots without outliers. The cumulative proportions of the first, second and third PCs (PC1, PC2, and PC3) were 44.8, 57.6 and 67.0%. The same analyses presented for all datasets are shown in Supplementary Fig. S2