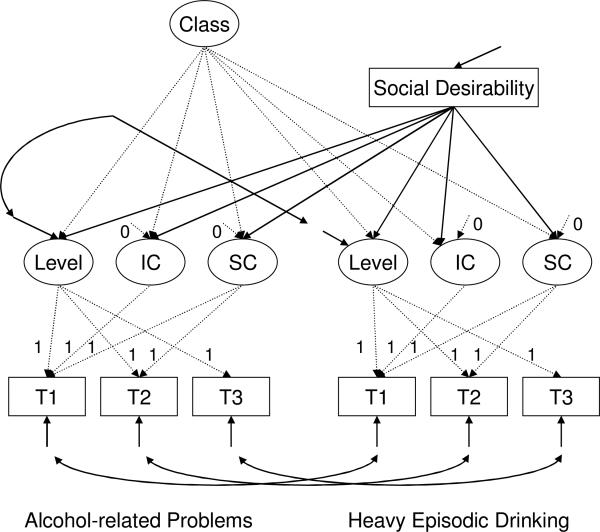
Figure 2.
Analyzed mixture models using latent change variables. Solid lines indicate directly estimated parameters and dotted lines indicate either fixed parameters (i.e., factor loadings) or a mixture part of the analyzed model (i.e., class to latent variables). Social desirability was constrained to be equal in mean, variance, and its paths across classes. Level = Outcome levels at 15 months post intervention, IC = Initial change from baseline to 4 months post intervention, SC = Subsequent change from 4 months to 15 months post intervention. Figure 3 shows the results for each alcohol use measure. T1 = baseline, T2 = 4 months post intervention, T3 = 15 months post intervention.

