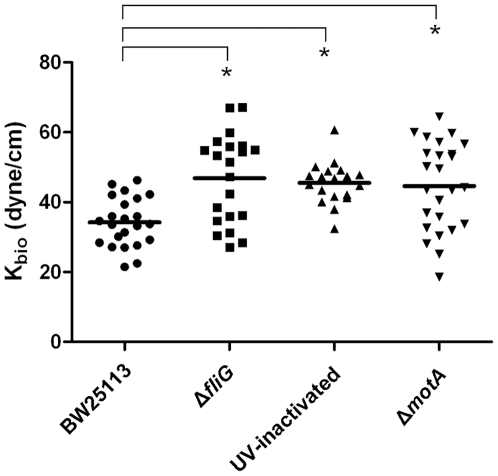
Figure 3. Measurement of the interaction of the bacterium with the surrounding LB agar in terms of the interaction force constant (Kbio).
The Kbio values, representing the interacting forces between bacterium and 0.2% LB-agar, were measured by oscillatory optical tweezers. In each group, about 20 measurements were performed and every single spot represents a measured Kbio value; the horizontal line marks the average of the group. Asterisk indicates that a statistically significant difference is observed between the paired strains (p<0.001 by t-test).

