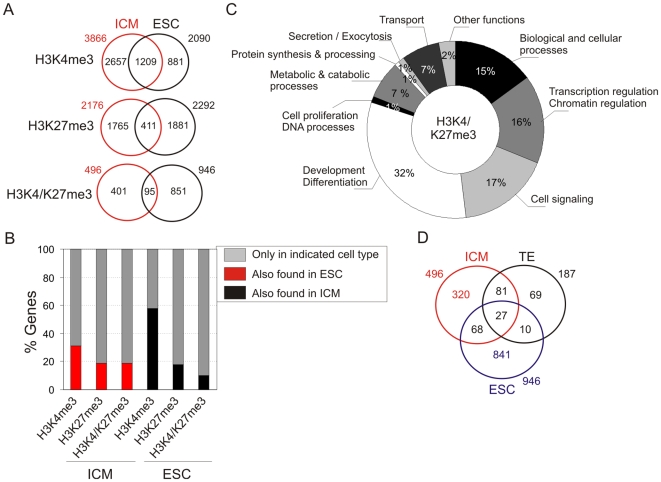
Figure 5. Divergence of H3K4me3 and H3K27me3 enrichment profiles between ICM and ESCs.
(A) Venn diagram analysis of H3K4me3, H3K27me3 and H3K4/K27me3 promoters retaining and losing these marks after derivation of ESCs. (B) Percentages of promoters enriched in H3K4me3, H3K27me3 or both marks in the ICM and ESCs. (C) GO term representation of all H3K4/K27me3 genes identified in both the ICM and ESCs. (D) Venn diagram analysis of H3K4/K27me3 promoters in the ICM, TE and ESCs.

