Fig. 2.
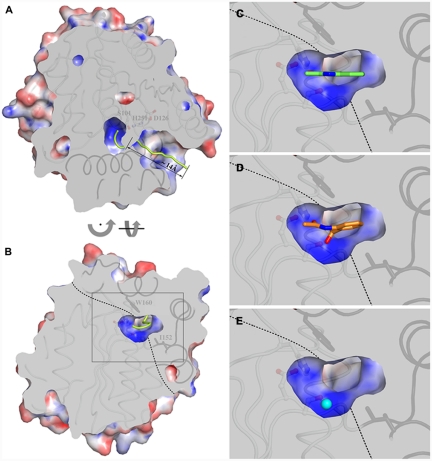
(A) Sliced-surface top-view (from the cap domain) highlighting access to the active site cavity. The centroid of the channel leading to the catalytic center is shown as a yellow trace. Residues below the slicing planes are shown as ribbons with core domain and cap domain structural elements in light and dark gray, respectively. Residues of the catalytic triad are shown in ball-and-stick mode. The molecular surface is colored according to the electrostatic potential. Positive and negative potential are shown in blue and red, respectively. (B) Sliced-surface back-view (opposite to the channel entrance) showing a vertical section of the active site cavity corresponding to the middle of the basin. The dotted line indicates the approximate boundary between the core domain and the cap domain. Residues Trp160 and Ile192 of the cap domain, which play an important role in shaping the catalytic pocket, are shown in stick representation. (C– E) Magnified view of the active site section framed in (B) by the gray rectangle with the substrate (C), product (D), and chloride ion as O2 mimic (E) bound to HOD. For clarity, bound molecules are shown unclipped. Tunnel and electrostatic potential calculations were performed with the programs MOLE (34) and APBS (35), respectively.

