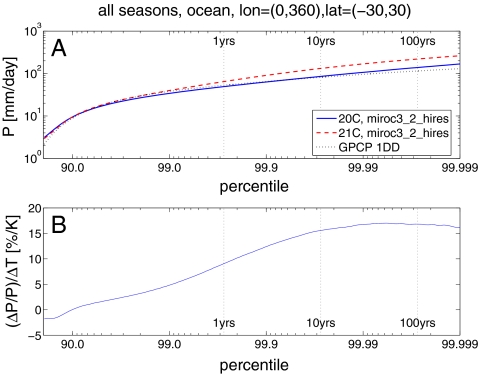
Fig. 1.
(A) Inverse cumulative distribution functions CDFs of daily precipitation over the tropical (30°S–30°N) oceans from the high-resolution version of MIROC and the observational dataset GPCP 1DD (1997–2005). The vertical dotted lines represent the CDF values that correspond to the return periods of 1, 10, and 100 yr. (B) Fractional changes in precipitation per unit warming of the target area.

