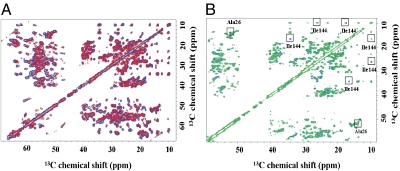
Fig. 2.
Combined use of solid-state and solution NMR. (A) Superimposition of the aliphatic region of the ferritin 13C-13C NOESY spectrum acquired in solution (blue trace) and in the solid-state13C-13C DARR spectrum (red trace) permits the transfer of the solid-state assignments to solution data and vice versa. The two 2D maps were overlaid by looking for the best superimposition of the aliphatic part. (B) Superimposition of the aliphatic region of the ferritin 13C-13C NOESY spectra acquired in solution before (blue) and after (green) the addition of 1 equivalent of iron (II) (2 iron(II)/active site; 48 iron(II)/nanocage); resonances disappearing upon formation of iron (III) products are labeled.

