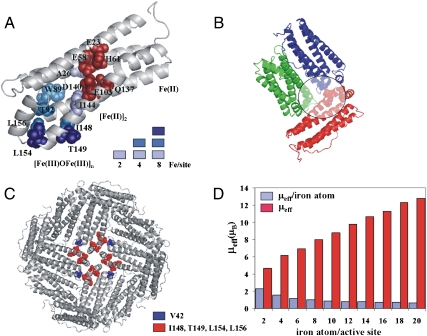
Fig. 3.
Tracing the iron channel in ferritin by paramagnetic effects. (A) NMR resonances that disappear in 13C-13C NOESY solution spectra, as the iron:protein ratio increases, are mapped onto the ribbon structure of a ferritin subunit as colored spheres (1 equivalent of iron = 2 iron(II)/active site = 48 iron(II)/nanocage). 1 equivalent: light blue, 2 equivalents: blue, 4 equivalents: dark blue. (B) View of the internal surface of the ferritin protein cage showing the relative spatial relationship near channel exits into the cavity; iron(III) products emerging from the channel of the red subunit have paramagnetic effects on residue V42 in the blue subunit and on R72 and G74 in the green subunit, after 4 equivalents of iron are added. Paramagnetically broadened residues are shown as spheres. (C) Ferritin channel exits in four adjacent subunits surround the four fold axes of the ferritin protein cage: V42 (blue spheres); I148, T149, L154, and L156 (red spheres). (D) Effective magnetic moments per subunit (μeff, red bars) and average magnetic moment per iron atom (μeff/iron atom, blue bars) obtained by Evans measurements at increasing concentrations of iron.

