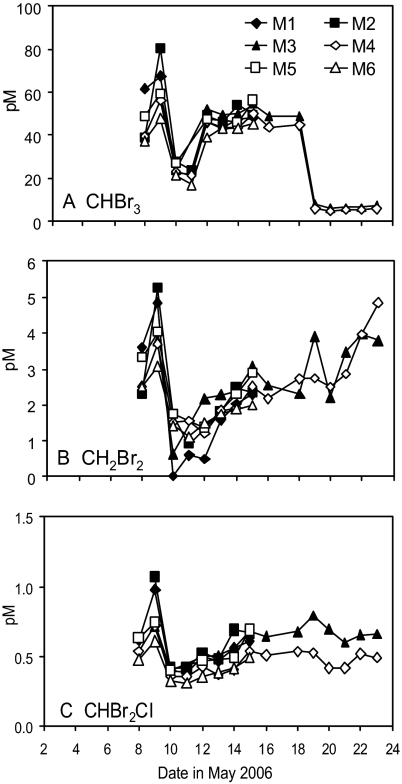
Fig. 2.
Temporal changes in the concentrations (pM) of bromoform CHBr3 (A), dibromomethane CH2Br2 (B), and dibromochloromethane CHBr2Cl (C) over the course of the experiment. For the bloom period of May 10 to 17, significant differences were found for CHBr2Cl (T = −2.82, P = 0.008). The postbloom period of May 18 to 23 saw increases in CHBr3 (+14%) and CHBr2Cl (+29%) in the high CO2 M3, and CH2Br2 (+0.3%). See Tables S1–S5 for details of statistical analyses.

