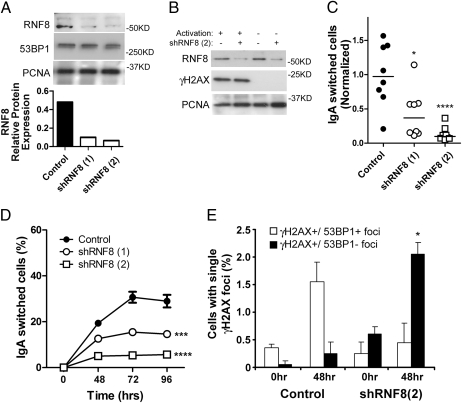
Fig. 2.
CSR is impaired in RNF8-deficient CH12F3-2 cells. (A) Western blot analysis quantifying RNF8, 53BP1, and PCNA (loading control) in CH12F3-2 cells with control shRNA and two different lentiviral vectors targeting RNF8(1) and (2). (B) Western blot analysis of stimulated and unstimulated control or shRNF8-treated CH12F3-2 cells, quantifying RNF8 and γH2AX protein levels, with PCNA as the loading control. (C) Eight individual clones for each of control, shRNF8(1), shRNF8(2), and CH12F3-2 cells were stimulated for 3 days and then analyzed for IgA expression. Values were normalized by dividing the % IgA-positive cells in the experimental group to the % IgA-positive cells in the stimulated parental CH12F3-2 cells. Statistical significance was evaluated by the two-tailed t test. *P <.05; ****P <.0001. (D) Two control, two shRNF8(1)-treated, and two shRNF8(2)-treated CH12F3-2 clones were stimulated, and IgA expression was analyzed at 2, 3, and 4 days poststimulation. Statistical significance was tested by two-way ANOVA. ***P <.001; ****P <.0001. (E) Stimulated control and shRNF8 CH12F3-2 cells were collected at times 0 h and 48 h and then stained with antibodies specific to γH2AX and 53BP1. Cells from two separate experiments (each with n = 1,000), having single γH2AX foci with 53BP1 (γH2AX ± 53BP1+ foci) or without 53BP1 (γH2AX ± 53BP1- foci) colocalization were counted and analyzed as shown. More than 90% of the cells did not exhibit γH2AX foci after cytokine stimulation. Statistical significance was tested using the two-tailed t test between control 48 h and shRNF8(2) 48 h. *P = .014.

