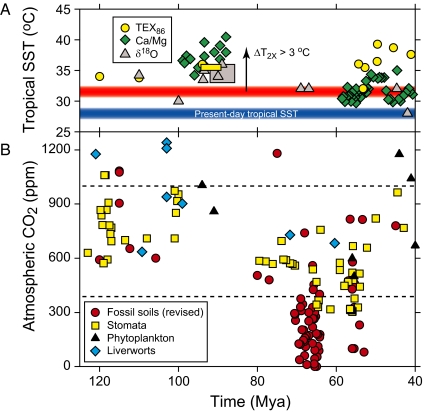
Fig. 1.
Constraints on climate sensitivity for the globally warm Cretaceous and early Paleogene (125–40 Mya). (A) Tropical sea surface temperature (SST) records (15–29). Boxes represent studies with high sampling density. The red band corresponds to estimated tropical SST under an atmospheric CO2 concentration of 1,000 ppm and a climate sensitivity (ΔT2×) of 3°C per CO2 doubling. Temperatures above this band probably represent times when climate sensitivity exceeded 3°C (see text). (B) Atmospheric CO2 records (compilation from ref. 2). Dashed lines correspond to present-day CO2 (387 ppm; A.D. 2009) and 1,000 ppm CO2. Records from the boron proxy are excluded because they are likely unreliable (30); records from the goethite and nahcolite proxies are excluded because they are not yet widely applied.

