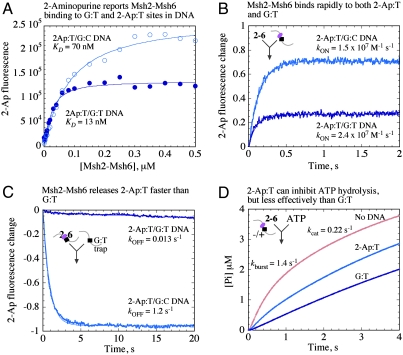
Fig. 2.
An on-site 2-Ap reporter confirms that Msh2-Msh6 dissociation rates underlie target site selectivity. (A) Equilibrium 2-Ap fluorescence measurements yield KD = 13 ± 2 nM for G:T2-Ap (dark blue) and 70 ± 7 nM for G:C2-Ap DNA (light blue); 2-Ap:T (purple dot) is located next to G:T or G:C, respectively. (B) Kinetic measurements yield kON = 2.4 and 1.5 × 10⁷ M-1 s-1 and (C) kOFF = 0.013 and 1.2 s-1 for G:T2-Ap and G:C2-Ap, respectively. (D) ATP hydrolysis is partially suppressed by G:C2-Ap DNA.

