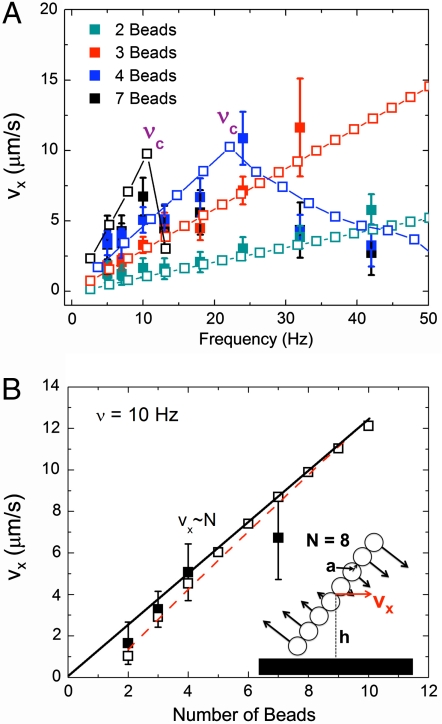
Fig. 2.
(A) Graph of average translational chain velocity, vx, versus frequency, ν, as a function of the number of beads. Both experimental (filled symbols) and simulation (open symbols) results are shown. Lines between simulation points are a guide to the eye. At high ν both the experimental and simulation data suddenly decay to a low-velocity regime due to the onset of chain breakup. (B) Graph of the velocity at ν = 10 Hz versus the number of beads in the chain from experiments (filled symbols), simulation (open, black symbols), and the analytical equation derived in SI Text (red dashed line). The data quickly approaches the linear regime predicted by using the long-chain limit of the analytical equation (Eq. 1) as demonstrated by the fit line. The schematic shown in the inset is a diagram of the geometric variables used in this paper: a is the bead radius, h is the rotor height (measured from the surface), N is the number of beads, and vx is the translational velocity of the rotor.

