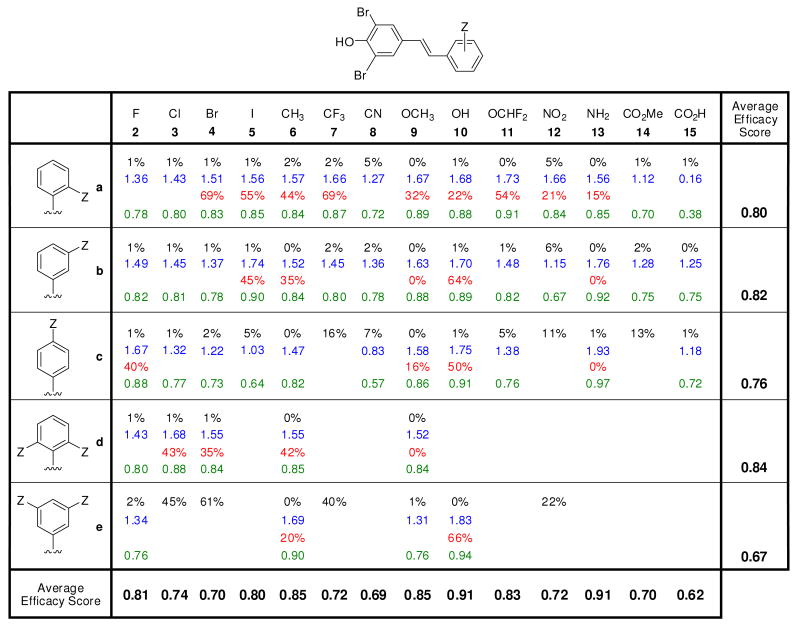
Figure 2.
Evaluation of the potency and selectivity of stilbene-based TTR kinetic stabilizers. Percent (%) fibril formation (F.F.) values are in black font representing the extent of in vitro WT-TTR (3.6 μM) fibril formation in the presence of inhibitor (7.2 μM) relative to aggregation in the absence of inhibitor (assigned to be 100%). The TTR tetramer binding stoichiometry of potent aggregation inhibitors (defined as those exhibiting < 10% F.F.) bound to human plasma TTR ex vivo are shown in blue font (10.8 μM kinetic stabilizer concentration, maximum binding stoichiometry is 2 due to the two thyroxine binding sites per TTR tetramer). Extent of competitive binding of potent (based on % F.F. as defined above) and highly selective (defined as those exhibiting a human plasma TTR binding stoichiometry > 1.5) TTR kinetic stabilizers to the thyroid hormone receptor is shown in red font. Individual efficacy scores (as defined by eq. 2) of TTR kinetic stabilizers are shown in green font, whereas average efficacy scores (defined by eq. 1) are shown at the bottom of the columns (reflecting the average value in a column) and at the right side of the rows, reflecting the average value of the compounds in that row.

