Figure 1.
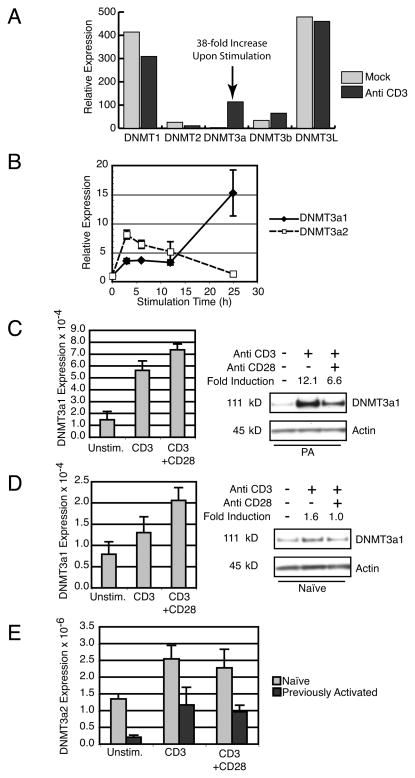
DNMT3a expression is regulated by TCR stimulation. (A) Microarray analysis of DNMT family members in A.E7 T cells cultured without stimulation (Mock) or with plate-bound anti-CD3 mAb. (B) Real-time PCR of previously activated 5C.C7 TCR Tg T cells stimulated for indicated times with plate-bound anti-CD3. Expression of DNMT3a1 (black diamonds) and DNMT3a2 transcripts (white squares) is shown as the fold induction compared to unstimulated cells. Error bars depict standard deviation of triplicate samples. Results are representative of three experiments. (C) Left, Real-Time PCR for DNMT3a1 from previously activated 5C.C7 T cells cultured overnight under indicated conditions. Error bars depict standard deviation of triplicate samples. Results are representative of three experiments. Right, Western blot of DNMT3a1 from whole cell lysates of previously activated 5C.C7 T cells cultured overnight under indicated conditions. Fold Induction is normalized to Actin expression. Results are representative of three experiments. (D) Left, Real-Time PCR for DNMT3a1 from naïve 5C.C7 T cells cultured overnight under indicated conditions. Error bars depict standard deviation of triplicate samples. Results are representative of two experiments. Right, Western blot of DNMT3a1 from whole cell lysates of naïve 5C.C7 T cells cultured overnight under indicated conditions. Fold Induction is normalized to Actin expression. Results are representative of three experiments. (E) Real-Time PCR for DNMT3a2 from naïve (light grey) and previously activated (dark grey) 5C.C7 T cells cultured overnight under indicated conditions. Error bars depict standard deviation of triplicate samples. Data are representative of 2 (naïve) and 3 (previously activated) independent experiments.

