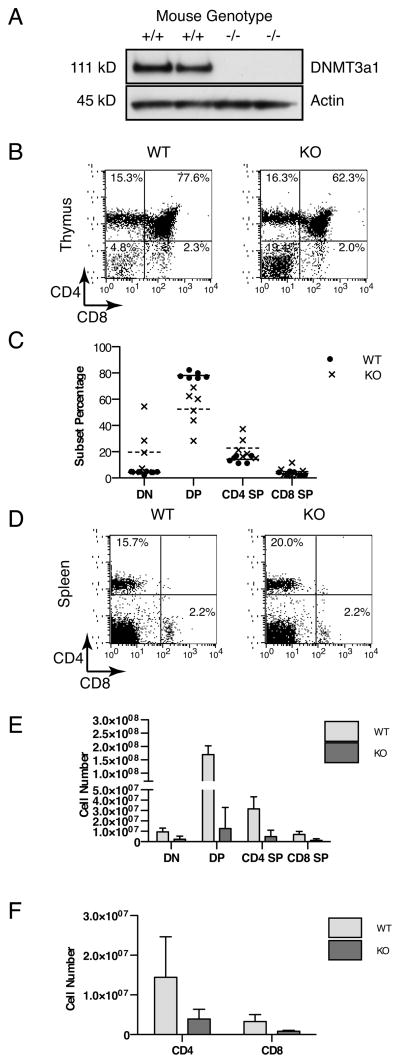
Figure 2.
DNMT3a KO mice are capable of generating peripheral T cells at similar frequencies to WT. (A) Western blot for DNMT3a1 (111 kD) or Actin (45 kD) prepared from whole cell lysates of thymocytes from individual DNMT3a WT or KO mice. (B) Flow cytometry depicting CD4 versus CD8 staining of thymocytes from a representative pair of DNMT3a WT and KO mice. (C) Percentages of thymocyte subsets (DN, double negative; DP, double positive; CD4 SP, CD4 single positive; CD8 SP, CD8 single positive) from N=6 mice per group with solid horizontal bar indicating mean value for WT and dashed horizontal bar indicating mean value for KO. (D) Flow cytometry depicting CD4 versus CD8 staining of splenocytes from a representative pair DNMT3a WT and KO mice. Results are representative of at least six independent experiments. (E) Absolute number of each thymocyte subset for DNMT3a WT (light grey) and KO (dark grey) mice from N=6 mice per group with bars depicting mean and error bars depicting standard deviation. (F) Total cellularity of pooled spleen and lymph nodes from DNMT3a WT (light grey) and DNMT3a KO (dark grey) mice with N=6 mice per group. Bars depict mean value and error bars depict standard deviation.

