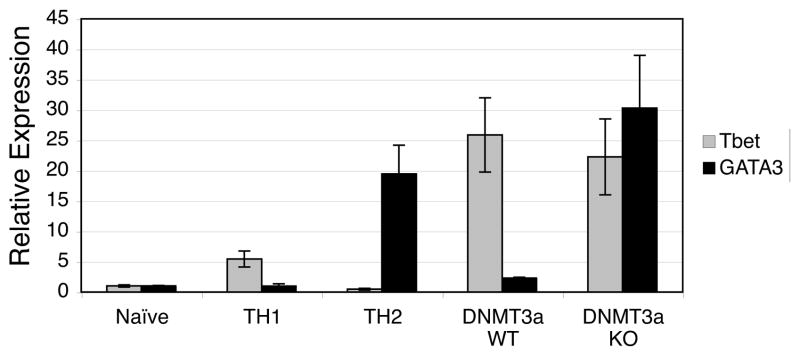
Figure 4.
T-bet and GATA-3 are expressed in DNMT3a KO T cells. Real-time PCR was performed on cDNA prepared from the indicated samples. DNMT3a WT and KO cells had been cultured for 5 weeks resulting in cytokine expression as shown in Figure 3B. Relative expression is plotted with that of naïve T cells set to 1. The figure depicts mean±standard deviation of triplicate samples and is representative of two experiments.

