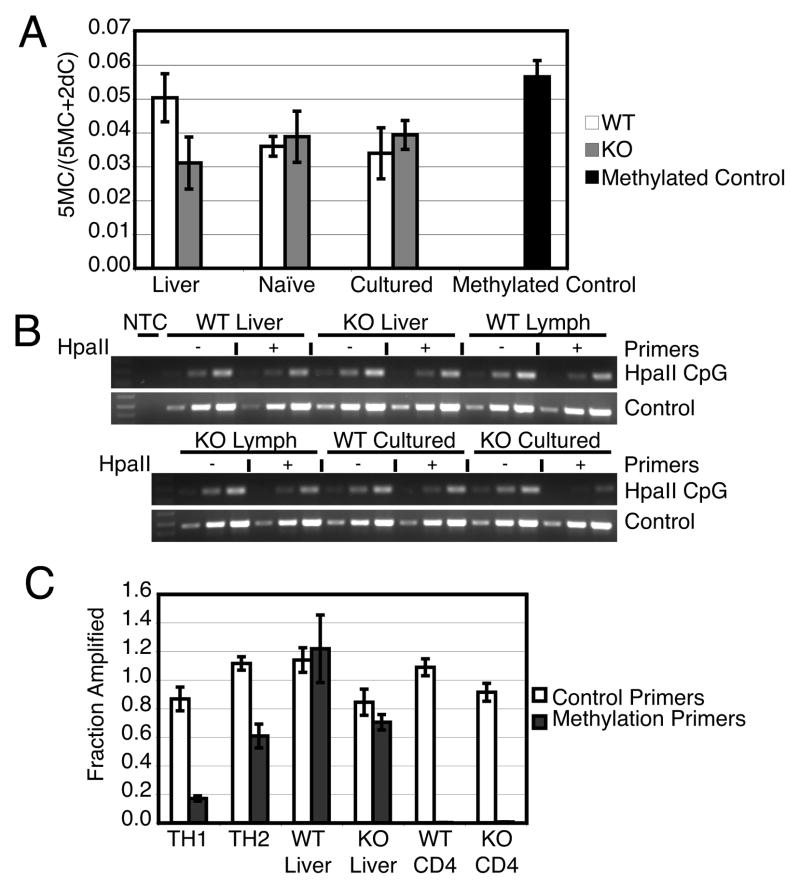
Figure 5.
Genomic DNA methylation in DNMT3a WT and KO T cells. (A) Total genomic DNA 5-methylcytosine content determined after hydrolysis using GC-MS. The fraction of methylated cytosine is depicted as the mean±standard error of triplicate samples. Differences in means between WT and KO samples of each tissue assessed by unpaired two tailed t-test (liver p= 0.1388, naïve p= 0.7440, cultured p= 0.5652) were not significant. (B) Il4 gene methylation as detected by methylation sensitive restriction digestion and semi-quantitative PCR. Indicated genomic DNA samples were incubated without (−) or with (+) HpaII. Semiquantitative PCR was performed in 3 reactions on serial diluted input (left to right equals low to high input). WT Cultured and KO Cultured samples are from cells cultured 5 weeks with cytokine expression as depicted in Figure 3B. Results are representative of three experiments. (C) Ifng promoter methylation determined by methylation sensitive restriction digestion and quantified by Real-time PCR. WT CD4 and KO CD4 cells were cultured for 5 weeks with cytokine expression as depicted in Figure 3B. Bars depict mean±standard deviation of triplicate samples and are representative of three experiments.

