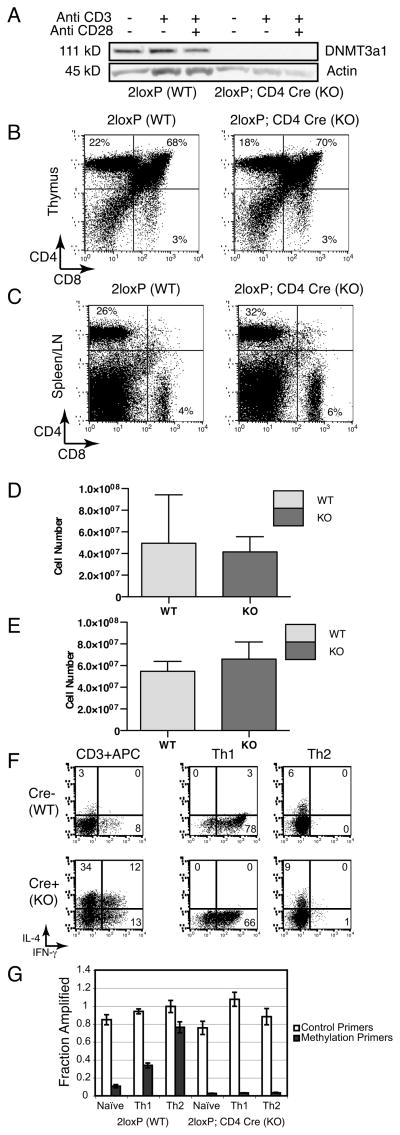
Figure 6.
T cell conditional DNMT3a KO mice have normal lymphocyte cellularity, distributions, and CD4 T cell polarization to Th1 and Th2 cells but they fail to methylate the Ifng promoter. (A) Western blot for DNMT3a1 (111 kD) or Actin (45 kD) prepared from whole cell lysates of DNMT3a 2loxP; CD4-Cre − (WT) and CD4-Cre+ (KO) CD4 T cells left unstimulated or cultured overnight with anti-CD3 alone or anti-CD3 + anti-CD28. Data are representative of two experiments. (B) Flow cytometry depicting CD4 and CD8 staining from representative DNMT3a 2loxP (WT) and 2loxP; CD4 Cre (KO) mouse thymocytes. Data are representative of three independent experiments. (C) Flow cytometry depicting CD4 and CD8 staining of pooled spleen and lymph node cells. Data are representative of three independent experiments. (D) Mean cellularity of the thymus from DNMT3a 2loxP (WT) and 2loxP;CD4 Cre (KO) mice with error bars depicting standard deviation. N=3 WT and 4 KO mice per group. (E) Mean cellularity of pooled spleen and lymph nodes from DNMT3a 2loxP (WT) and 2loxP;CD4 Cre (KO) mice with error bars depicting standard deviation. N=3 WT and 4 KO mice per group. (F) Flow cytometry depicting IL-4 versus IFN-γ intracellular staining of CD4 T cells from DNMT3a 2loxP WT (top) or 2loxP; CD4-Cre KO (bottom) mice. Cells were cultured under the indicated conditions for 2 weeks prior to measurement of cytokine secretion. Results are representative of three experiments. (G) Ifng promoter methylation determined by methylation sensitive restriction digestion and quantified by Real-time PCR as in Figure 5C. Samples are prepared from DNMT3a 2loxP (WT) or DNMT3a 2loxP; CD4-Cre (KO) mice cultured under the indicated conditions for 2 weeks. Results are shown as the mean±standard deviation of triplicate samples and are representative of three experiments.

