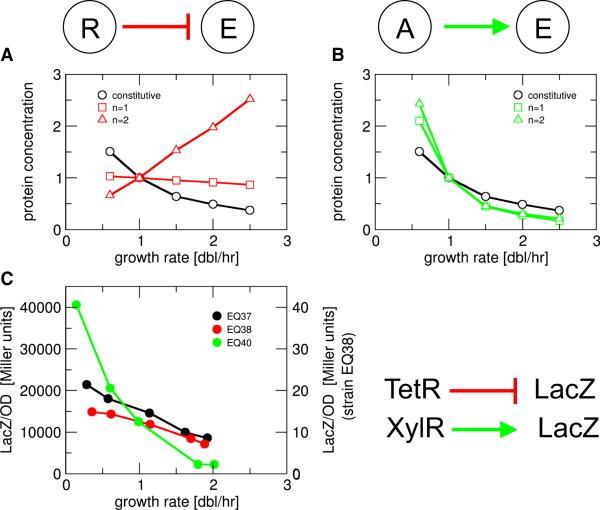
Figure 4. Growth-rate dependence of simple negative and positive regulation.
Concentration of a protein under (A) negative regulation by a constitutively expressed repressor, and (B) positive regulation by a constitutively expressed activator. The two plots are generated, respectively, by Eq. (S9) and Eq. (S11) in the Supporting Text, for non-cooperative (Hill coefficient n=1, squares) and cooperative regulation (n=2, triangles). Black symbols show the concentration of constitutively expressed protein. The parameters used for the plots are r1/K=10 in (A), and a1/K=0.1 and f=100 in (B). (C) Experimental data for the concentrations of LacZ reporter under constitutive expression (strain EQ37: PLtetO1-lacZ, no tetR, black), repression (strain EQ38: Pcon-tetR, PLTet-O1-lacZ, red) and activation (strain EQ40: PLlac-O1-dnxylR, Pu-lacZ, no lacI, green), showing weaker growth-rate dependence under repression and stronger growth-rate dependence under activation as compared to the constitutive case.

