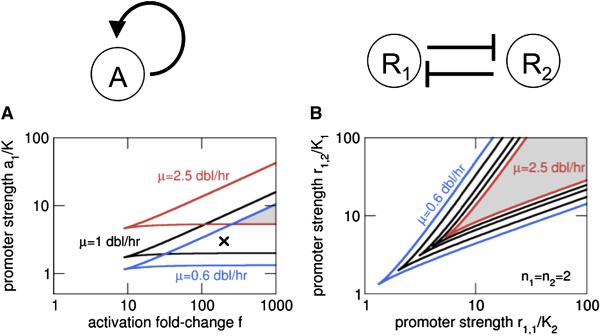
Figure 6. Effects of growth rate on bistable genetic circuits.
The parameter ranges for bistability at different growth rates are plotted for (A) the autoactivator and (B) the toggle switch. The lines describe boundaries of the bistable regime, obtained from linear stability analysis of Eq. (S18) for (A) and Eqs. (S19) and (S20) for (B). The grey areas indicate the parameter range for which bistability is obtained over the full range of growth rates considered here (0.6-2.5 dbl/hr).

