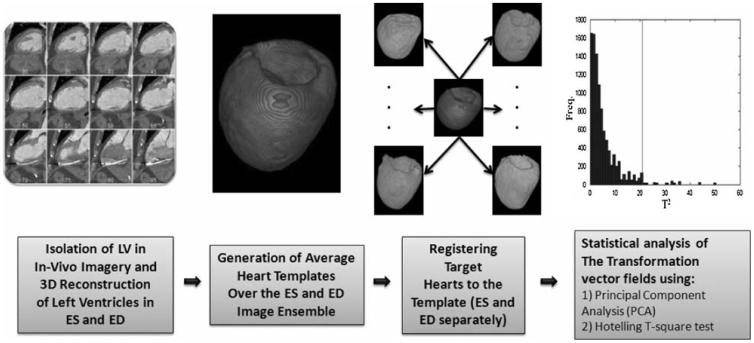
FIGURE 1.
Schematic illustration of the work-flow used for LV shape analysis. After isolating and reconstructing the LV, images were segmented to remove any non-cardiac tissue (not shown). This process improved the accuracy of the image matching algorithm. Next, average LV shape models (templates) were generated separately for ED and ES using affine and non-linear transformations. Once each template was generated, the template was matched to the target LVs using the LDDMM algorithm. Deformation vector fields (the initial momenta) calculated at this step were used to perform statistical shape analysis.

